COMING SOON

20-City Composite Home Price Index
HIGH (7d)
LOW (7d)
Index Level
Change (24h)
Change (7d)
Updated
DESCRIPTION
TRADE THIS INDEX ON
Coming soon
SOURCE CONTRACTS
SOURCE
VENUE
WEIGHT
No source contracts added.
CURRENT READ
Modal bin
Outcomes
INDEX DETAILS
Venues
Volume (total)
Open interest
Liquidity
MARKET-IMPLIED PROBABILITY DISTRIBUTION
Target Expiry
Mode Outcome
Excluded Probability
Observed At
DAILY VOLATILITY
ANNUALIZED VOLATILITY
RANGE (1 MONTH)
LATEST NEWS
PUBLISHED
August 13, 2026
Part 2: Current State of the Housing Market; Overview for mid-August 2026
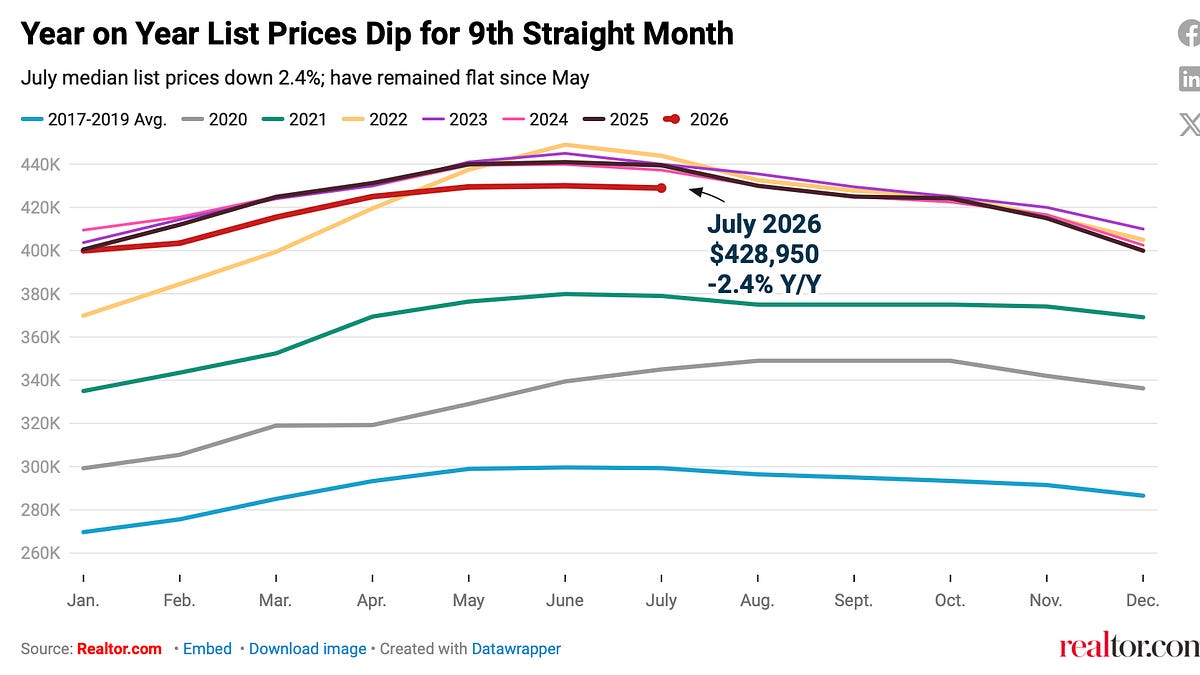
Bill McBride's mid-August housing overview finds national list prices have moved sideways for four years, with the Case-Shiller 20-city composite up just 1.6% year over year in May and seasonally adjusted prices down for a third straight month. He expects further softness through year-end as the market moves past its seasonal peak.
Read more
PUBLISHED
July 28, 2026
Case-Shiller: Miami home-price growth rises in May
The May S&P Cotality Case-Shiller data showed national home prices up 1.1% annually — the first 2026 reading above 1% but still well behind 4.2% inflation. Miami gained 1.81% year over year while Midwest and Northeast metros outperformed a cooling Sun Belt and West, with tight inventory putting a floor under prices.
Read more

PUBLISHED
July 28, 2026
Case-Shiller home prices rise 1.1% in May, still lag inflation
The Case-Shiller national index climbed 1.1% year over year in May to 335.1, accelerating from April's 0.8% pace but remaining below inflation, which hit a three-year high of 4.2%. That means US home prices are still declining in real terms and the market is notably weaker than a year ago.
Read more
